
By Janine O’Donnell, MPH and Maris Brummel, MPH, Kent County Health Department
Imagine you are looking at a jigsaw puzzle of a beautiful landscape. You see Lake Michigan in the foreground backdropped by sand dunes and the setting sun. The completed puzzle is like aggregated data—it’s the final, overall picture that doesn’t emphasize fine details.
Before you complete the “big picture”, you must consider the parts that make up the whole, like the water, sand, and sky. Disaggregating the data means sorting out the individual puzzle pieces, where each piece represents a specific detail or part of the larger image.
Understanding the health of a community is like doing a jigsaw puzzle. The completed puzzle shows a broad, overall summary of the community’s health. You also have individual puzzle pieces, where each piece represents the health of a different demographic group (think race/ethnicity, gender expression, or educational attainment as examples of possible groupings). Disaggregating the data highlights patterns or trends among specific subgroups that would otherwise be obscured if you only looked at the final picture without considering its parts. But what happens when you have missing puzzle pieces?
If a large portion of the shoreline pieces were missing, for example, you would lose important context of what is happening on the beach—is there a large group of people having a cookout? Is a single person walking the water’s edge? Perhaps you’re missing something crucial, like a person who is struggling to swim. Without the missing pieces, you would still be able to tell that the overall puzzle is a beach at sunset, but you wouldn’t know important facts about what is happening within the scene.
Some population groups are consistently un- or underrepresented in large samples of data, making data disaggregation for these groups impossible. They are essentially “invisible” in the data, meaning their unique needs are not considered when data is used for decision-making, resource allocation, and/or policy and program development. The inability to disaggregate data can perpetuate or even cause health inequities.
Data gaps can be caused by a variety of things, including:
- Survey design and lack of demographic questions necessary for disaggregation;
- Limited trust between marginalized communities and large institutions most often responsible for surveying;
- Survey fatigue from repeated requests to participate in surveying efforts; and/or
- A lack of confidence that participation will result in change for their community.
To address gaps in Community Health Needs Assessment (CHNA) data, the Kent County Health Department (KCHD) in Kent County, Michigan piloted a new, community-led approach to data collection. Community-based organizations (CBOs) were paid to lead surveying efforts in their respective communities with the goal of increasing representation of specific populations in the CHNA and providing CBOs with disaggregated data from their community. Community members and organizations were also engaged early to help guide the overall CHNA process.
A county-wide convenience sample survey has consistently been a data collection method used in Kent County’s CHNA process to gather community input from populations whose voice and health status may not be reflected in existing data sources. (In brief, this means that individuals are included in the sample due to ease of access, e.g., proximity, convenience, and willingness to participate). However, in past CHNA cycles, this has resulted in a sample with an overrepresentation of those who are non-Hispanic, white, female, living in urban or suburban areas, and have higher incomes and educational attainment than the overall population of Kent County. For the most recent iteration of Kent County’s CHNA (2023), there was an intentional focus to increase representation among specific population groups, including: communities of color, members of the LGBTQ+ community, individuals with limited English-speaking abilities, individuals with disabilities, immigrants, refugees, and those living in rural parts of the county.
Partners and CBOs were engaged early in the CHNA process to evaluate previous cycles and provide recommendations to increase participation in the community survey. One key theme from their feedback was that community engagement is not a “one-size-fits-all” approach and CBOs that are trusted by the community are best suited to lead their own engagement efforts. Twelve partner organizations committed to lead surveying efforts in their communities and received a $2,000 stipend along with survey promotion materials. The funding and flexibility enabled organizations to address the unique barriers or deterrents to participation in their community and compensate staff who were conducting outreach and survey administration. The survey was available online in English and Spanish, while paper copies of the survey were available in English, Spanish, Arabic, Kinyarwanda, Swahili, and Vietnamese. The final convenience sample yielded 2,948 responses over a 5-week data collection period.
Partners who received funding to promote and administer the survey collected 68% of responses, and the overall sample more closely matched the demographics of Kent County’s population for sex, race, ethnicity, and educational attainment (see Figure 1). There was also a notable increase in the number of responses for priority population groups, as well as new data for refugees and immigrants due to an expanded demographics section. This allowed for data disaggregation to measure and address the specific needs within these communities. Several partners indicated they would use their community-specific data to develop strategic plans within their organizations, create or modify programming, and apply for future funding opportunities.
Figure 1: Changes in survey respondent demographics with community-led data collection
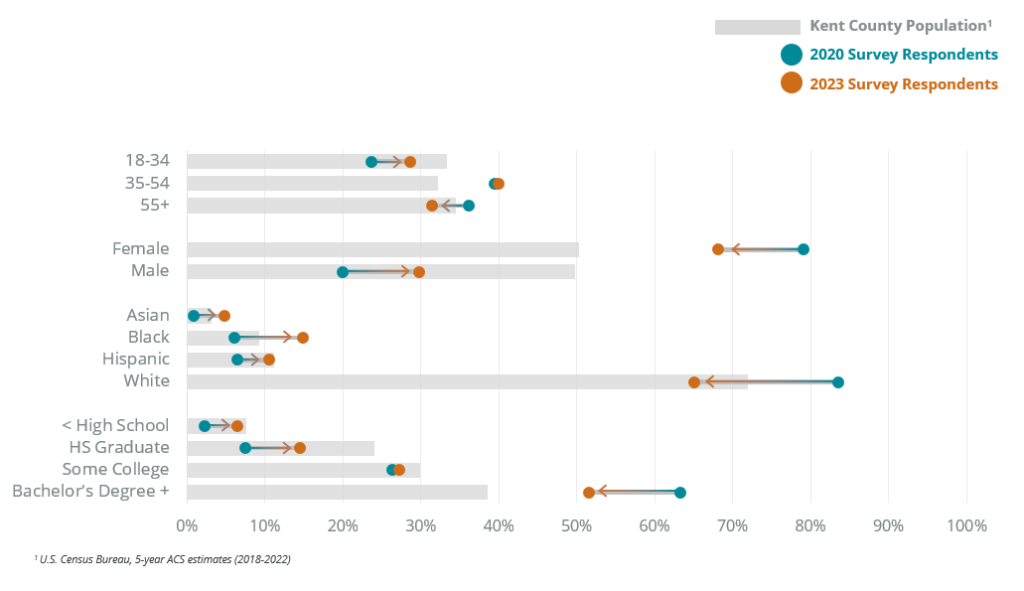
Changes in survey respondent demographics with community-led data collection
Using a community-led data collection approach in the 2023 Kent County Community Health Needs Assessment (CHNA) resulted in a sample that more closely matched the demographics of Kent County’s population compared to the 2020 CHNA.
How to read this figure: teal dots represent 2020 survey respondents, orange dots represent 2023 survey respondents, and arrows indicate whether there was an increase or decrease from 2020 to 2023. For instance, there was an increase in Asian, Black, and Hispanic survey respondents from 2020 to 2023, and a decrease in White survey respondents from 2020 to 2023.
The lack of available data for some population groups is an ongoing challenge in public health and can result in masking the inequities or poor health outcomes those communities disproportionately face. Partnering with trusted organizations who serve those communities is a promising first step to help improve representation in data and understand their unique needs. Additional steps towards improving data equity include “closing the loop” on data collection by providing partners with their disaggregated data (ensuring data ownership is held by community) and providing partners with individualized reports or one-pagers. To build on 2023 community-led surveying efforts and continue addressing gaps in data, ongoing partner engagement is necessary to understand how partners are using their disaggregated data, how the information collected can better address data gaps, and how public health agencies can provide additional data support.