
Featured image: Copyright 2023 John Hosteen
By Carrie Carroll, MPA, Sustainability Strategy Leader, University of Wisconsin Population Health Institute
UW Population Health Institute’s 2023 County Health Rankings shows how public health and health care can nurture civic health.
The University of Wisconsin Population Health Institute’s (UW PHI) 2023 County Health Rankings has released a National Findings Report that connects communities’ civic health to health and well-being.
This year’s report shows that people and places thrive when everyone has the chance to participate in their community.
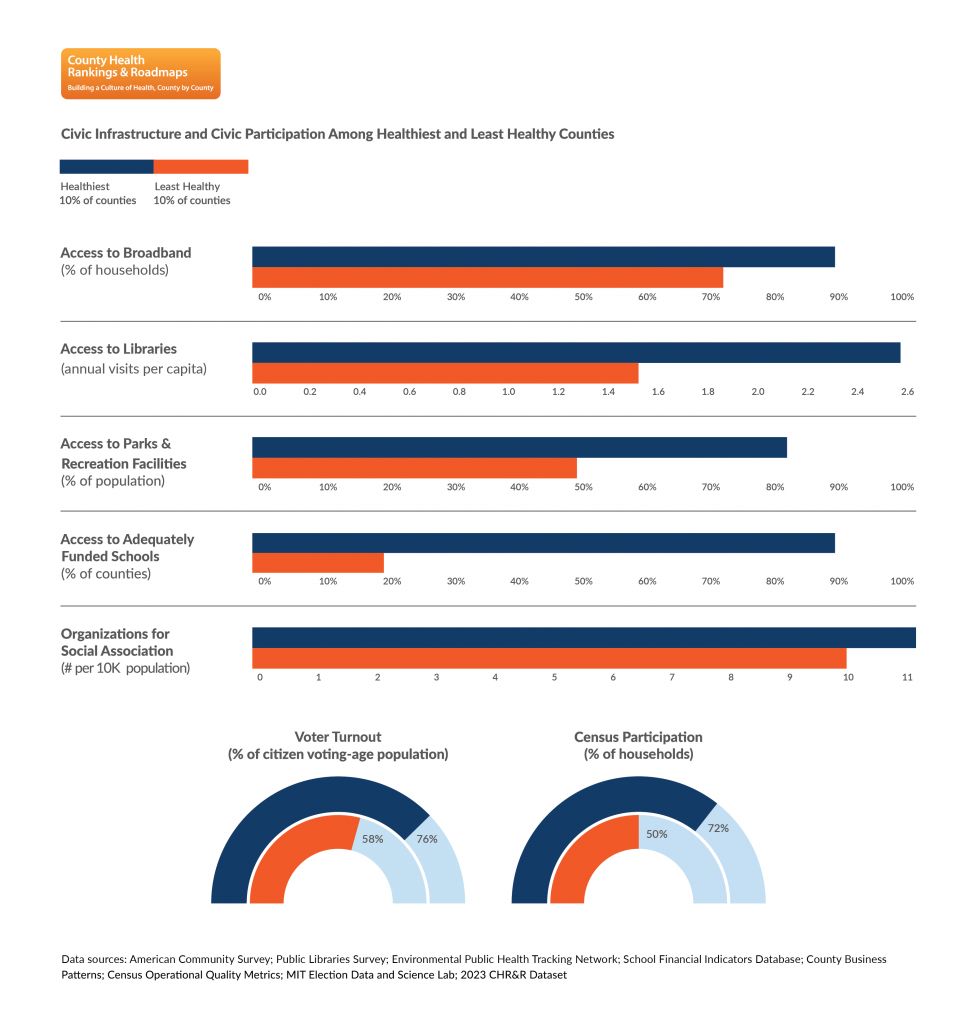
Two elements of civic health are highlighted:
- Civic infrastructure – the places like schools, parks and libraries that keep us connected as well as the policies and practices that encourage belonging and fuel inclusive civic participation.
- Civic participation – how people engage in community life, whether by voting or volunteering or mentoring, to improve conditions and build a better future.
Well-resourced civic infrastructure and active civic participation can improve health. Both allow communities to tap the collective knowledge, wisdom and action of residents.
Geographic patterns emerged in both civic infrastructure and civic participation. Specific examples include:
- In the most recent presidential election, 66% of the citizen voting-age population voted, with the highest turnout in the West, Northeast, and Midwest where civic infrastructure is more robust.
- Similarly, 60% of households self-responded to the census, with higher participation in the Midwest and Northeast.
Are there new measures this year?
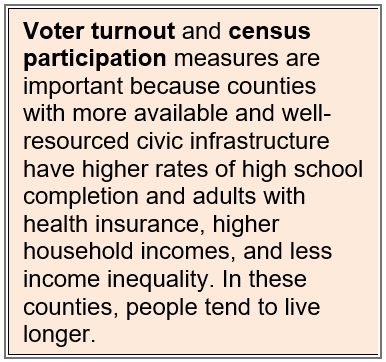
To dig deeper, website visitors can search for their state or county on countyhealthrankings.org. Snapshots include two new measures this year: voter turnout and census participation.
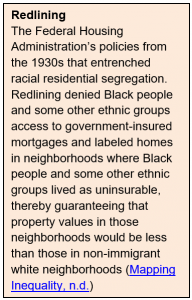
Also new this year: county descriptions that include context such as Indigenous nations native to the land, characterization of the population density and connection to large cities, and neighborhoods that have experienced intentional disinvestment through redlining.
What role can public health and health care play in nurturing civic health?
There are lots of opportunities for public health and health care to continue to lead collaborative action to nurture civic health. Some examples include:
- Partnering with community health workers and community organizers to ensure fair representation and a voice in community decisions by supporting transportation to city council and school board meetings.
- Advocating for state and local elections infrastructure funding, such as automatic voter registration systems.
- Following the federal government’s lead by incorporating the Healthy People 2030‘s research objective to increase the proportion of voting age people who vote into state and local Health Improvement Plans.
- Sharing research on the connection between civic participation and health in advocacy efforts to eliminate laws that exclude people.
- Partnering with communities on decisions that affect their lives.
- Implementing programs such as Vot-ER which develops nonpartisan civic engagement tools and programs for health care practitioners, medical schools, and hospitals.
To learn more, check out these resources:
- County Health Rankings website
- 2023 County Health Rankings National Findings Report: Cultivating Civic Infrastructure and Participation for Healthier Communities
- New and updated What Works for Health strategies including voter registration initiatives, voter turnout initiatives, participatory budgeting and youth civics education.
- Blog post on What’s New for the 2023 Rankings
- Webinar recording from March 14: Getting Ready for the 2023 County Health Rankings Release
- Upcoming webinar on Engaging across differences: Constructive dialogue for civic health: April 18, 2023 at 3pm EDT
- Blog post on new equity analysis in What Works for Health, a database of strategies
- In Solidarity Podcast on Civic Health